
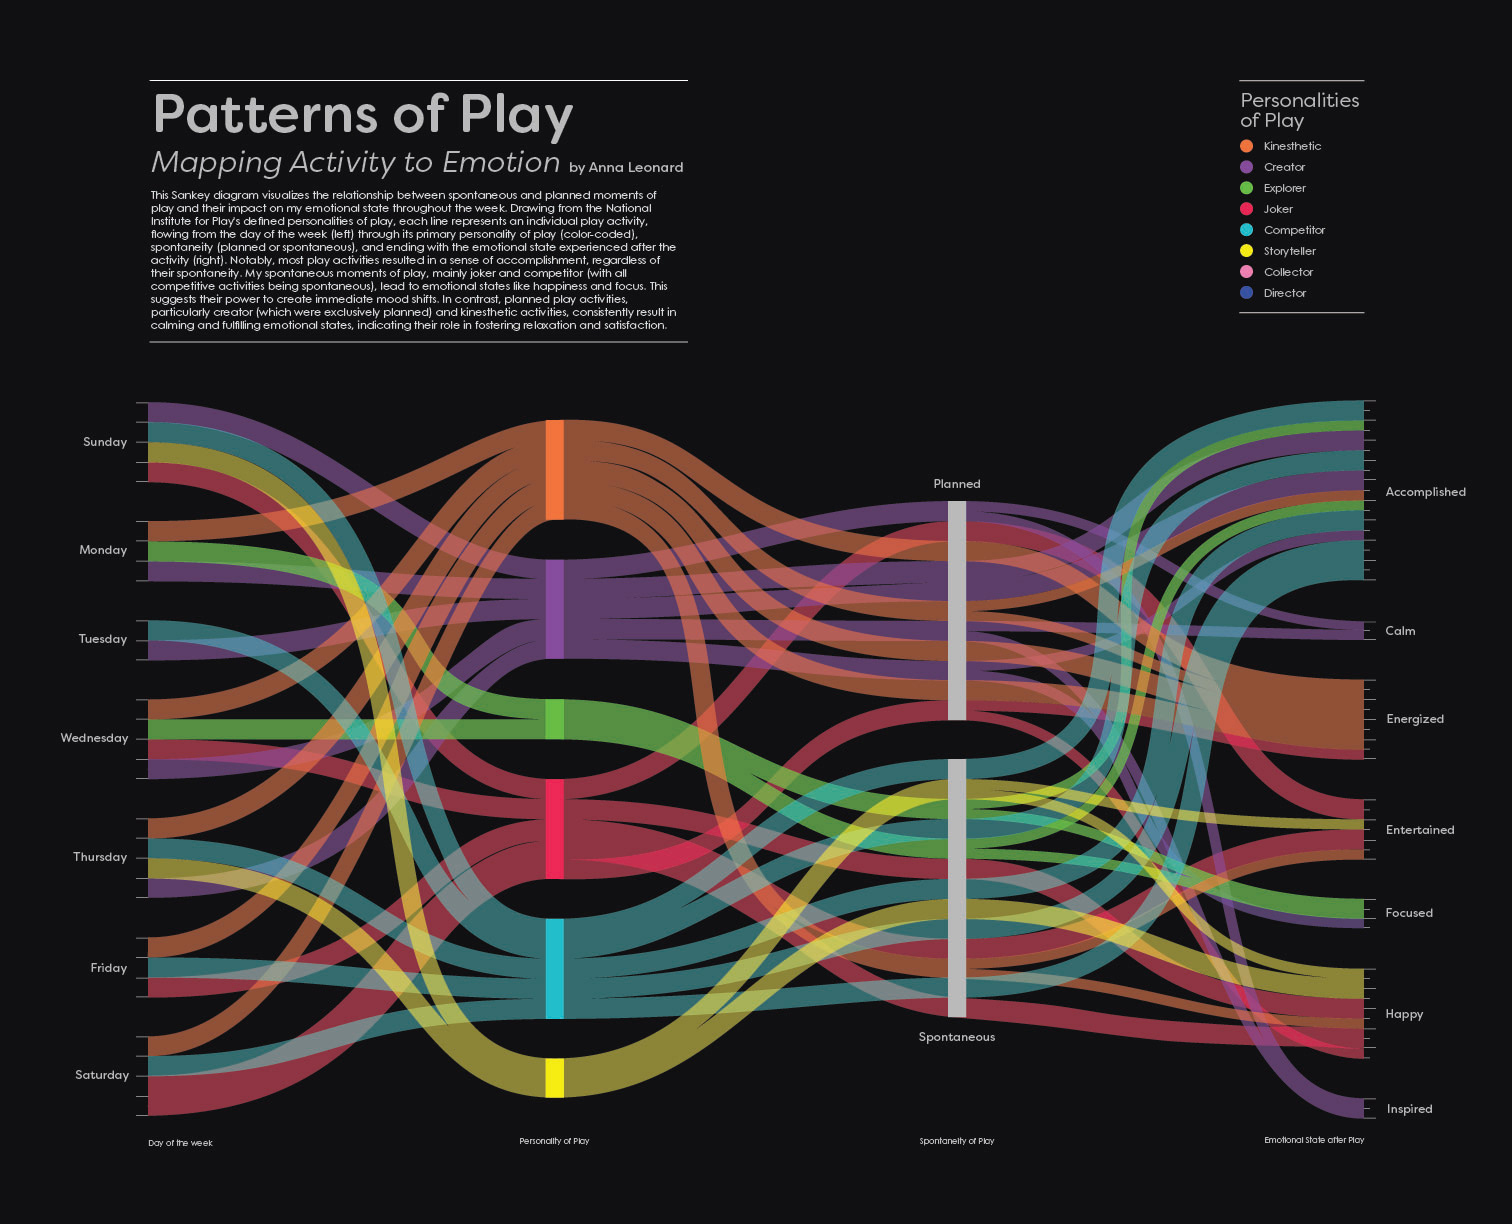
To explore the relationship between spontaneous moments of play and emotional state throughout the day, a Sankey diagram was created as the primary form of data visualization. This format was chosen for its ability to clearly illustrate the flow and interconnectedness between multiple variables: day of the week, type of play activity, play personality, planned versus spontaneous play, and emotional state after play. The Sankey diagram emphasizes movement and transition, reflecting the idea that play is a fluid and dynamic part of everyday life.
Each line flowing through the diagram represents a distinct play activity, color-coded by its dominant play personality (e.g., Explorer, Director, Storyteller). Lines begin at the day of the week, travel through the play type, split into planned or spontaneous, and arrive at the resulting emotional state. This visualization highlights how unstructured, spontaneous play—particularly those rooted in creativity and exploration—is often linked to positive emotional shifts, such as feeling energized, calm, or connected.